
Every roofing contractor knows steep slopes drain profitability. Yet most track only obvious costs like material orders and labor hours, while the real killers operate invisibly. The crew makes another ladder trip. A bundle slides six feet down the slope. The lead installer waits three minutes for materials. Each incident feels minor, but the compounding effect transforms a profitable 8/12 pitch project into a break-even nightmare.
The solution isn’t working harder or accepting lower margins. It requires a fundamental shift from reactive safety equipment to proactive workflow engineering. Strategic roof anchors function as productivity multipliers when positioned according to material flow patterns rather than generic safety guidelines. This approach transforms steep slopes from profit drains into measurable efficiency gains.
From invisible losses to measurable gains, the path forward follows five critical steps: quantify the real cost hiding in daily operations, diagnose the structural causes making traditional methods fail on pitches above 6/12, deploy strategic anchor solutions as workflow infrastructure, ensure human adoption through proven protocols, and prove ROI with concrete metrics that emerge within two projects.
Steep Slope Efficiency Framework in 5 Steps
- Quantify hidden hourly costs using crew rate multiplied by idle time per ladder trip and daily trip count
- Understand why physics makes materials accelerate unpredictably on slopes above 7/12 regardless of placement care
- Position anchors at material handoff points using flow mapping to eliminate double-handling and reduce movement by 60%
- Implement crew adoption protocol starting with demonstration on steepest projects to maximize visible wins
- Track three metrics across two projects: ladder trips per square, material waste rate, and labor hours per square
The compounding cost nobody tracks: quantifying inefficiency on steep slopes
Most roofing businesses measure project costs through material invoices and payroll hours. This accounting captures what you bought and what you paid, but completely misses what you lost. On steep slopes, the invisible costs accumulate in three-minute increments, five-percent waste margins, and afternoon productivity drops that never appear on any invoice.
The first calculation reveals the ladder trip tax. Take your crew’s hourly rate, multiply by average idle time per trip, then multiply by daily trip count. A three-person crew at $35 per hour loses $17.50 every time someone makes a ten-minute round trip to the truck. On a 12/12 slope requiring 20 trips daily, that’s $350 in pure idle time before accounting for the secondary effect of disrupted workflow rhythm.
Material waste compounds even more insidiously. A contractor accepting three-percent loss per project as normal watches that margin balloon to 15-20% across a full season. The math works against you because waste doesn’t distribute evenly. Steep projects generate disproportionate losses, and the damaged materials that can’t be returned transform into unrecoverable sunk costs that insurance categorizes as normal business waste.
| Roof Pitch | Daily Ladder Trips | Time Lost (hours) | Cost Impact |
|---|---|---|---|
| 4/12 slope | 8-10 trips | 1.5 hours | $120-150/day |
| 8/12 slope | 12-15 trips | 2.5 hours | $200-250/day |
| 12/12 slope | 18-22 trips | 4 hours | $320-400/day |
The afternoon fatigue factor delivers the final blow to productivity. Research analyzing 138 locations and 33 construction crews found that excess work-in-progress time and workflow discontinuities showed the most significant association with productivity losses. On steep slopes, this manifests as a documented 40% efficiency drop after lunch when accumulated physical strain meets afternoon heat.
The safety cost deserves separate accounting. Industry data shows 134 deaths in 2023 from roofing work, with 80% attributed to falls, making fall protection not just regulatory compliance but financial survival. Every near-miss creates crew hesitancy, every incident triggers insurance reviews, and every serious fall can end a business regardless of project profitability.
Material waste tracking method
- Document material quantities delivered to site daily
- Track actual installation rates per crew member
- Record damaged/dropped materials separately
- Calculate waste percentage weekly
- Multiply by seasonal project volume for annual impact
These calculations transform vague frustration into quantifiable business intelligence. When you can assign dollar values to ladder trips, percentage points to material waste, and hour metrics to fatigue-driven slowdowns, the true cost of inefficiency becomes undeniable. This financial clarity creates the foundation for justifying systematic solutions rather than accepting losses as inevitable steep-slope penalties.
Why traditional staging methods fail on pitches above 6/12
The breaking point sits somewhere between 6/12 and 7/12 pitch. Below that threshold, traditional staging methods work adequately despite their inefficiencies. Above it, the same approaches that functioned on moderate slopes begin failing in ways that compound throughout the project. The failure isn’t random—it’s structural, predictable, and rooted in physics that improvised solutions can’t overcome.
Material slide acceleration follows gravitational physics that intensify exponentially with slope angle. On a 4/12 roof, a bundle placed carelessly might shift a few inches. On an 8/12 slope, that same bundle accelerates unpredictably, gathering momentum until it hits an obstacle or flies off the edge. The geometric reality means steep slopes exponentially increase fall distance for dropped items, transforming minor fumbles into material losses and safety incidents simultaneously.
Analysis of fall fatality data reveals 70% of roofer deaths occur at roof edges, the exact zone where traditional ladder-based staging creates the highest material handling density. The irony compounds: the most dangerous area becomes the most trafficked zone because conventional workflow design offers no alternative access points.

The single-point access bottleneck creates crew collision and dead time that skilled workers instinctively try to solve through improvisation. One installer waits at the ladder while another descends. A third crew member attempts to pass materials across the slope instead of up and down. These workarounds feel productive but actually multiply risk while barely improving throughput.
Temporary hooks, rope systems, and improvised material staging all share a fatal flaw: they weren’t engineered for the combined stress of workflow pressure, weather exposure, and the constant weight cycling of real installation work. What holds adequately during initial setup fails under the accumulated stress of a full workday when crew fatigue reduces setup diligence.
| Slope Grade | Base Productivity | Actual Output | Efficiency Loss |
|---|---|---|---|
| Low-slope (≤4/12) | 100 sq ft/hour | 95 sq ft/hour | 5% |
| Steep (6/12) | 100 sq ft/hour | 75 sq ft/hour | 25% |
| Very Steep (>9/12) | 100 sq ft/hour | 55 sq ft/hour | 45% |
Falls from steep roofs can result in serious injuries or fatalities… only guardrail, safety netting, and personal fall arrest systems are allowed
– Philip Jacklin, Diversified Fall Protection
The productivity data confirms what experienced contractors feel intuitively. A 45% efficiency loss on very steep slopes isn’t the result of lazy crews or poor planning. It’s the inevitable outcome of workflow design that fights physics instead of accommodating it. Traditional methods fail because they were developed for moderate slopes and applied to steep applications without the fundamental redesign that changed conditions demand.
Recognition of structural failure rather than individual error shifts the solution framework entirely. You can’t train or incentivize your way past physics. You can’t improvise past geometric realities. The only viable path requires engineering workflow infrastructure that works with steep-slope physics instead of against it.
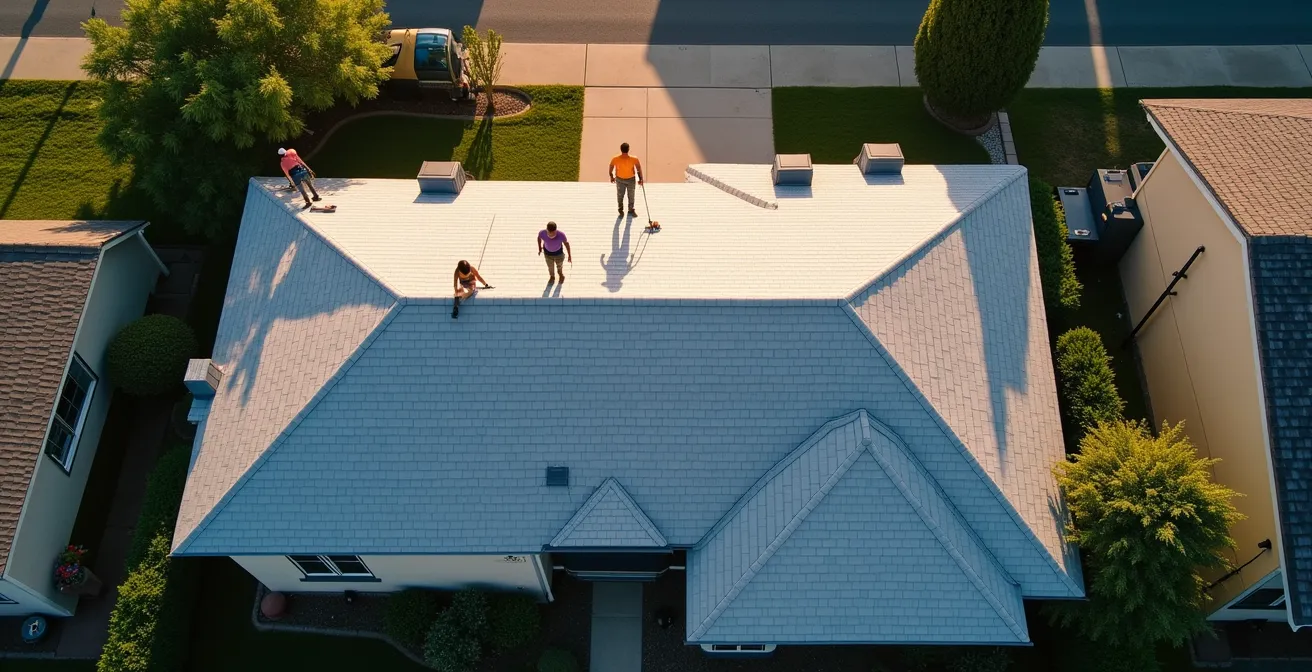
Strategic anchor placement: engineering your workflow, not just safety
The standard approach treats roof anchors as safety equipment—install them where regulations require, use them to comply with fall protection standards, consider the mission accomplished. This perspective misses the transformative potential of anchors as workflow infrastructure. When positioned according to material flow mapping rather than generic safety guidelines, anchors become productivity multipliers that pay for themselves through efficiency gains rather than merely preventing losses.
Material flow mapping starts with tracking how materials actually move across your roof. Where do bundles land when hoisted? Which zones require the highest material density? What paths do crew members walk repeatedly? The answers reveal natural handoff points where strategic anchor placement eliminates double-handling. Instead of carrying materials from ladder to staging area to installation point, properly positioned anchors create secured zones at each transition.
The labor shortage intensifies the value of efficiency gains. Industry projections indicate 439,000 additional workers needed by 2025 across construction sectors, making productivity per existing crew member increasingly critical. When you can’t simply hire more installers, you must engineer systems that multiply the output of current teams.
Creating gravity-assisted work zones represents the conceptual shift from fighting physics to leveraging it. On steep slopes, gravity constantly pulls materials downward. Traditional staging fights this by trying to hold everything in place. Strategic anchor positioning creates secured zones that allow controlled material flow down-slope, using physics to deliver materials to installation points rather than constantly battling uphill movement.
The movement distance reduction formula considers roof geometry, material weight, and crew size to determine optimal anchor spacing. A typical configuration reducing crew movement by 60% positions anchors at 15-20 foot intervals on moderate pitches, tightening to 10-12 feet on slopes above 8/12. This creates overlapping safety zones while simultaneously establishing material staging points that minimize horizontal travel.
Multi-anchor configurations eliminate bottlenecks by enabling parallel work streams. Instead of all crew members depending on single-point ladder access, a three-anchor system allows simultaneous material delivery, installation, and waste removal. This parallel processing transforms the efficiency equation more dramatically than any incremental improvement to serial workflows could achieve.
| Configuration | Coverage area | Key benefits |
|---|---|---|
| Single Point | 15-20 ft radius | Simple setup, minimal equipment |
| Dual Anchor | 40-50 ft span | Allows movement between zones |
| Multi-Point Grid | Full roof coverage | Maximum efficiency, parallel work |
The workflow engineering perspective also influences equipment selection. Just as choosing the right equipment matters in agricultural efficiency, anchor system selection should prioritize workflow optimization alongside safety compliance. Permanent anchor points rated for multiple attachment points enable the multi-zone configurations that deliver maximum productivity gains.
Implementation requires measuring existing workflow to establish baseline metrics before optimization. Track current ladder trip counts, material handling touches, and crew movement patterns on a representative steep-slope project. These baseline numbers prove the efficiency gains after strategic anchor deployment and provide the data foundation for ROI calculations that justify system expansion.
Getting your crew to actually use the system: the adoption framework
The gap between equipment purchase and realized benefits is filled entirely by human factors. The most strategically positioned anchor system delivers zero value if your crew views it as bureaucratic safety theater that slows down real work. Equipment resistance isn’t irrationality—it’s experienced professionals protecting hard-won workflow efficiency from perceived interference.
The first-project demonstration protocol structures initial adoption to prove value without disrupting crew dynamics. Select your smallest steep-slope project as the test case, eliminating the pressure of tight deadlines. Install the anchor system before crew arrival, removing setup time from their workflow disruption calculation. Position your most respected lead installer as the first user, leveraging peer credibility over top-down mandate.
Side-by-side timing data defeats the “it slows us down” objection with measurable reality. Split the roof into comparable sections. Time traditional method completion on one section, anchor-supported workflow on another. The data typically shows 20-30% time reduction on the anchor section within the first project, even accounting for learning curve inefficiency. This objective measurement bypasses subjective resistance.
Workforce demographics intensify the adoption challenge. Data reveals Hispanic workers face 50% higher fall fatality rates despite representing only 7.9% of the workforce, highlighting critical needs for multilingual training materials and culturally appropriate safety communication. Adoption protocols must account for language barriers, varying experience levels, and diverse cultural attitudes toward safety equipment.
Turning your lead installer into a system champion leverages social dynamics more powerful than management directive. Once the respected crew veteran experiences efficiency gains firsthand, peer influence propagates adoption faster than any top-down mandate could achieve. Experienced installers explaining benefits to newer crew members carries credibility that owner directives never match.
Crew buy-in protocol
- Demonstrate system on smallest, safest section first
- Time traditional method vs. anchor system side-by-side
- Have lead installer use system exclusively for one day
- Document time savings and share with entire crew
- Implement gradual rollout starting with steepest projects
The gradual rollout approach starts with your steepest, most problematic projects where efficiency gains appear most dramatically. Success on difficult applications builds credibility for broader deployment. Crews who see anchor systems conquering previously dreaded steep pitches develop confidence faster than mandated adoption on moderate slopes where benefits feel incremental.
Staffing challenges can delay timelines. Set realistic expectations for homeowners and highlight your stable, trained crew
– RoofLink Industry Report, 30 Roofing Industry Statistics
The skilled labor crisis makes crew retention increasingly valuable. Survey data shows 85% of contractors struggle to hire skilled labor in current market conditions, making existing crew satisfaction and safety critical business priorities. Systems that demonstrably reduce physical strain and safety risk become retention tools alongside their productivity benefits.
Documentation of the adoption process creates institutional knowledge that survives crew turnover. Video testimonials from lead installers explaining benefits, time-lapse comparisons showing efficiency gains, and written protocols for new crew orientation all build organizational capability beyond individual expertise. This systematic approach transforms anchor adoption from one-time implementation into permanent competitive advantage.
Equipment protection extends the adoption framework beyond initial deployment. Just as professionals learn to prevent equipment theft through GPS tracking and security protocols, anchor system maintenance and inspection protocols ensure long-term reliability that sustains crew confidence in the infrastructure.
Key takeaways
- Hidden costs on steep slopes compound through ladder trip idle time, material waste multipliers, and fatigue-driven productivity drops
- Traditional staging fails above 6/12 pitch due to physics of material acceleration and single-point access bottlenecks
- Strategic anchor placement as workflow infrastructure reduces crew movement by 60% through material flow mapping
- Crew adoption requires demonstration protocols, side-by-side timing data, and lead installer champions rather than top-down mandates
- Three trackable metrics prove ROI within two projects: ladder trips per square, material waste rate, and labor hours per square
Measuring success: three metrics that prove ROI within two projects
Measurement transforms anecdotal improvement into business intelligence that justifies system expansion and proves value to partners or investors. The three-metric framework captures efficiency gains without requiring complex software or dedicated tracking personnel. Simple observation and basic arithmetic reveal ROI faster than most contractors expect.
Ladder trips per square installed provides the most immediately visible metric. Baseline measurement on traditional workflow typically shows 12-15 trips per hundred square feet on steep slopes. After anchor system optimization, this drops to 3-5 trips covering the same area. The calculation requires only counting trips and recording square footage—data any crew member can collect without disrupting workflow.
Material reorder rate reduction tracking reveals waste elimination through simple percentage calculation. Compare material ordered versus square footage installed across similar projects. A baseline waste rate of 8-10% dropping to 2-3% represents thousands in recovered material costs over a season. The tracking method uses existing invoice data rather than requiring new measurement systems.
| Metric | Baseline | After 1 project | After 2 projects |
|---|---|---|---|
| Ladder Trips/Square | 12-15 | 7-9 | 3-5 |
| Material Waste Rate | 8-10% | 5-6% | 2-3% |
| Hours per Square | 3.2 | 2.6 | 2.1 |
Labor hour efficiency gain compares project completion time with controlled variables. Select comparable roof sections—similar pitch, square footage, and complexity. Time traditional installation on baseline project, then measure anchor-optimized workflow on subsequent projects. The progression from 3.2 hours per square to 2.1 hours represents a 34% efficiency gain that directly impacts project profitability and capacity.
The two-project timeline delivers meaningful data faster than expected because steep-slope work concentrates inefficiencies. Productivity improvements that might take months to detect on varied projects become obvious within weeks on challenging applications. This rapid feedback loop enables quick iteration on anchor positioning and workflow refinement.
Productivity metric implementation case study
An electrical contractor analyzed teams averaging 65 work hours per 1200 square feet and identified specific inefficiencies through detailed tracking. Mobile data capture and standardized reporting templates enabled 15% productivity improvement within 60 days. The methodology applies directly to roofing applications where similar mobile tracking and simple reporting reveal efficiency patterns quickly.
Secondary benefits emerge in customer satisfaction and market positioning. Project completion time reductions allow more accurate scheduling and fewer weather delays. Reduced material waste enables tighter bidding that wins projects without sacrificing margin. The measurable professionalism attracts premium customers willing to pay for reliability and proven expertise.
Energy efficiency represents an additional metric for clients focused on building performance. Modern installation practices enabled by anchor-supported workflow precision can deliver 10-20% reduction in cooling costs with proper material installation and ventilation techniques, creating selling points beyond basic weather protection.
Simple ROI tracking method
- Record baseline metrics on current project before changes
- Document exact time stamps for material movements
- Track crew member positions hourly
- Compare completion times between similar roof sections
- Calculate labor cost savings and material waste reduction
Documentation creates competitive advantage beyond immediate projects. Case studies with concrete metrics build marketing credibility. Insurance companies may offer premium reductions for documented safety improvements. The data foundation supports business development, financing applications, and strategic planning with objective performance evidence rather than subjective claims.
The measurement framework transforms anchor systems from cost centers into documented profit generators. When you can demonstrate 34% labor efficiency gains, 60% material waste reduction, and measurable safety improvements within two projects, expansion from experimental deployment to standard operating procedure becomes inevitable. The metrics prove that strategic anchor placement delivers returns that compound across every subsequent steep-slope project.
Frequently asked questions on roofing efficiency
What defines the red zone on a steep roof?
The red zone encompasses the first six feet from any roof edge, posing the greatest risk for falls and requiring maximum protection measures.
How do anchor points reduce material handling time?
Strategic anchor placement allows crews to secure materials at handoff points, eliminating double-handling and reducing movement distance by up to 60%.
What pitch angle makes traditional staging methods ineffective?
Slopes above 6/12 pitch create physics conditions where material acceleration becomes unpredictable and single-point ladder access creates severe workflow bottlenecks that traditional methods cannot overcome efficiently.
How quickly can crews see measurable efficiency improvements?
Most crews document significant improvements within two projects, with ladder trip reductions appearing immediately and material waste metrics becoming clear after the first complete installation cycle under the new system.